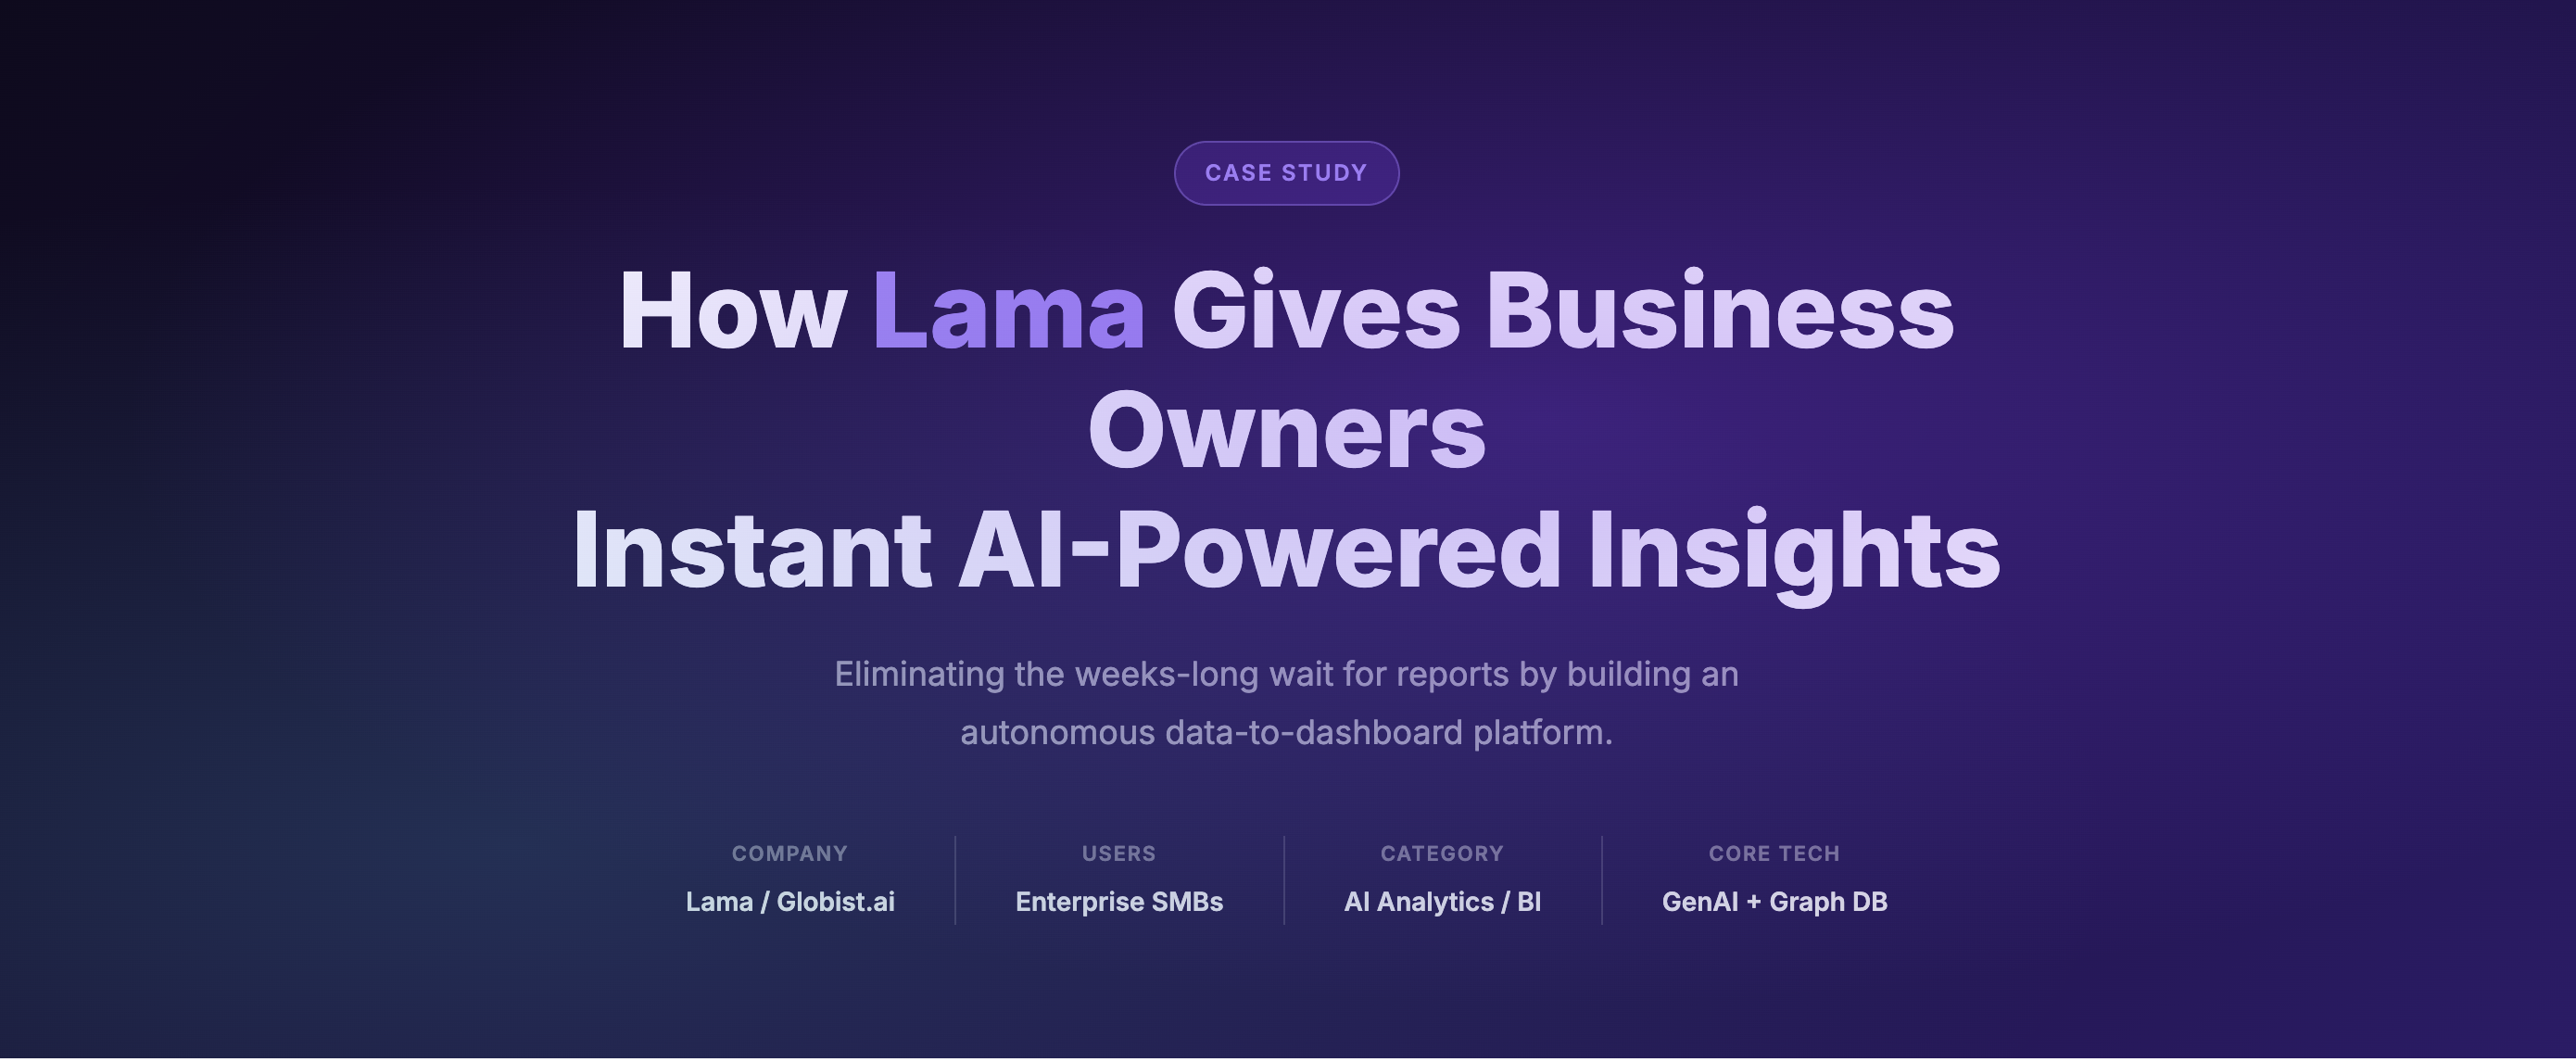
Case Study: How Lama Was Built to Close the Gap Between Business Data and Business Decisions
Adaptiv Admin
Mar 31, 2026 · 10 min read
Executive Summary
Lama is an AI-native business intelligence platform that ingests data from virtually any source - Jira, CSV exports, ServiceNow, Confluence, web scrapes, and more - and automatically produces rich, interactive dashboards with AI-generated analysis, risk assessments, and prioritised recommendations.
The platform was built around a single, non-negotiable constraint: a non-technical business owner must be able to go from raw data to actionable insight, without help from a developer or analyst. By combining a multi-LLM reasoning layer (OpenAI, Anthropic Claude, Google Gemini), a hybrid database architecture (MongoDB, Neo4j, PostgreSQL, Qdrant), and a real-time Flutter front end, Lama collapses a reporting process that once took weeks into one that takes minutes.
The Challenge
For most small and medium enterprises, acting on data requires a chain of handoffs. A business owner identifies a question, submits a request to a data analyst or developer, waits for them to pull data from disparate systems, clean it, model it, and produce a report, often in a static format that is outdated by the time it arrives.
This is not a niche problem. It affects nearly every non-technical founder, operations lead, and project manager who has ever typed "can you pull the numbers on X?" into a Slack message and waited.
The bottleneck creates compounding costs: decisions are delayed, opportunities close, and the people who understand the business most are the ones least able to interrogate the data that describes it.
"Business owners routinely wait weeks for reports that should take minutes. By the time insights land, the window for action has often closed."
The core challenges were consistent across the target users Lama was designed for:
Multi-week reporting lag. Requests routed through technical staff create queues. Business decisions are delayed or made on stale data while waiting for dashboards to be produced.
Data locked in silos. Project data lives across Jira, ServiceNow, Confluence, spreadsheets, and documents. No single unified view exists without significant manual consolidation effort.
Technical dependency. Existing BI tools assume the user can write queries or configure data models. Non-technical owners are locked out of self-service entirely.
Insight without context. Even when reports were produced, they rarely came with actionable recommendations — leaving interpretation to the business owner anyway.
Why Existing Solutions Aren't Enough
Traditional business intelligence platforms (Tableau, Power BI, Looker) are powerful, but they fundamentally assume a technical operator is in the loop. Newer AI-augmented tools have made meaningful progress, but none solve the full pipeline from raw, multi-format data to contextual insight without significant configuration overhead.
The gap was not a missing feature. It was an entirely different design philosophy. Existing tools were built to serve analysts. Lama needed to be built to serve decision-makers.
Specifically, no existing solution combined all of the following in a single product:
Zero-configuration data ingestion across heterogeneous sources (CSV, Jira, ServiceNow, documents, web)
AI-generated narrative insights with context, not just charts
Graph-based relationship analysis to surface hidden dependencies
Actionable, prioritised recommendations as a first-class output
A project planning pipeline (brief → scope → tickets → release) embedded in the same interface
That combination, and the user experience it enables, is what Lama is being built to deliver.
The Solution
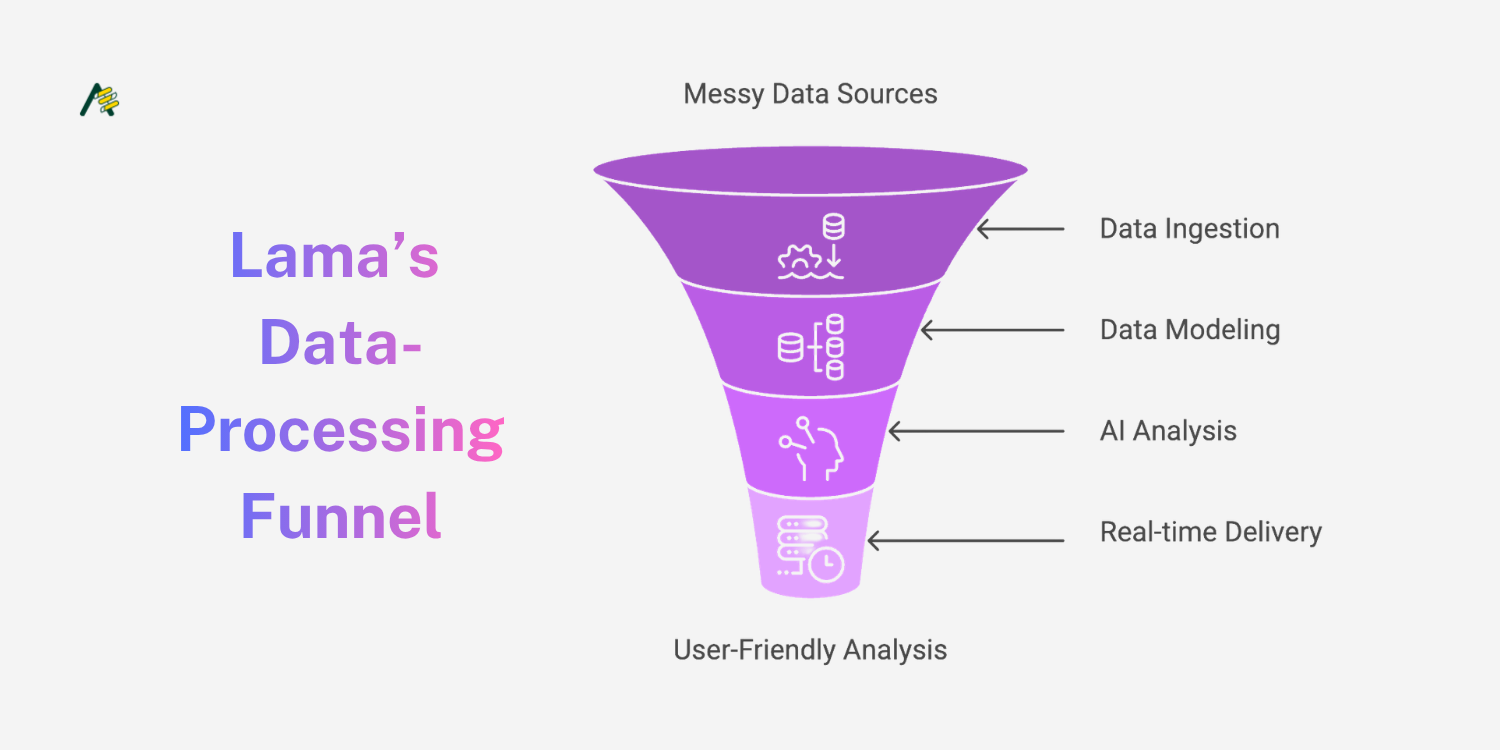
Lama sits between raw project data and business decision-making. It ingests, normalises, models, and analyses data automatically, then presents findings as interactive dashboards, narrative summaries, graph visualisations, and prioritised action lists. No SQL. No configuration. No waiting.
Universal Data Intake
Lama connects to Jira, Jira CSV, ServiceNow, IAM Identity, Confluence, uploaded documents, web scrape endpoints, and web crawl jobs. Each source is normalised into a unified internal schema at ingestion time — not at query time — so analysis is fast and consistent regardless of where the data originated.
Multi-LLM Reasoning
Rather than relying on a single AI provider, Lama orchestrates OpenAI, Anthropic Claude, and Google Gemini in parallel. Different models are routed different analysis tasks based on their performance characteristics on that task type. The result is richer, more accurate insight generation — and no hard dependency on any single provider.
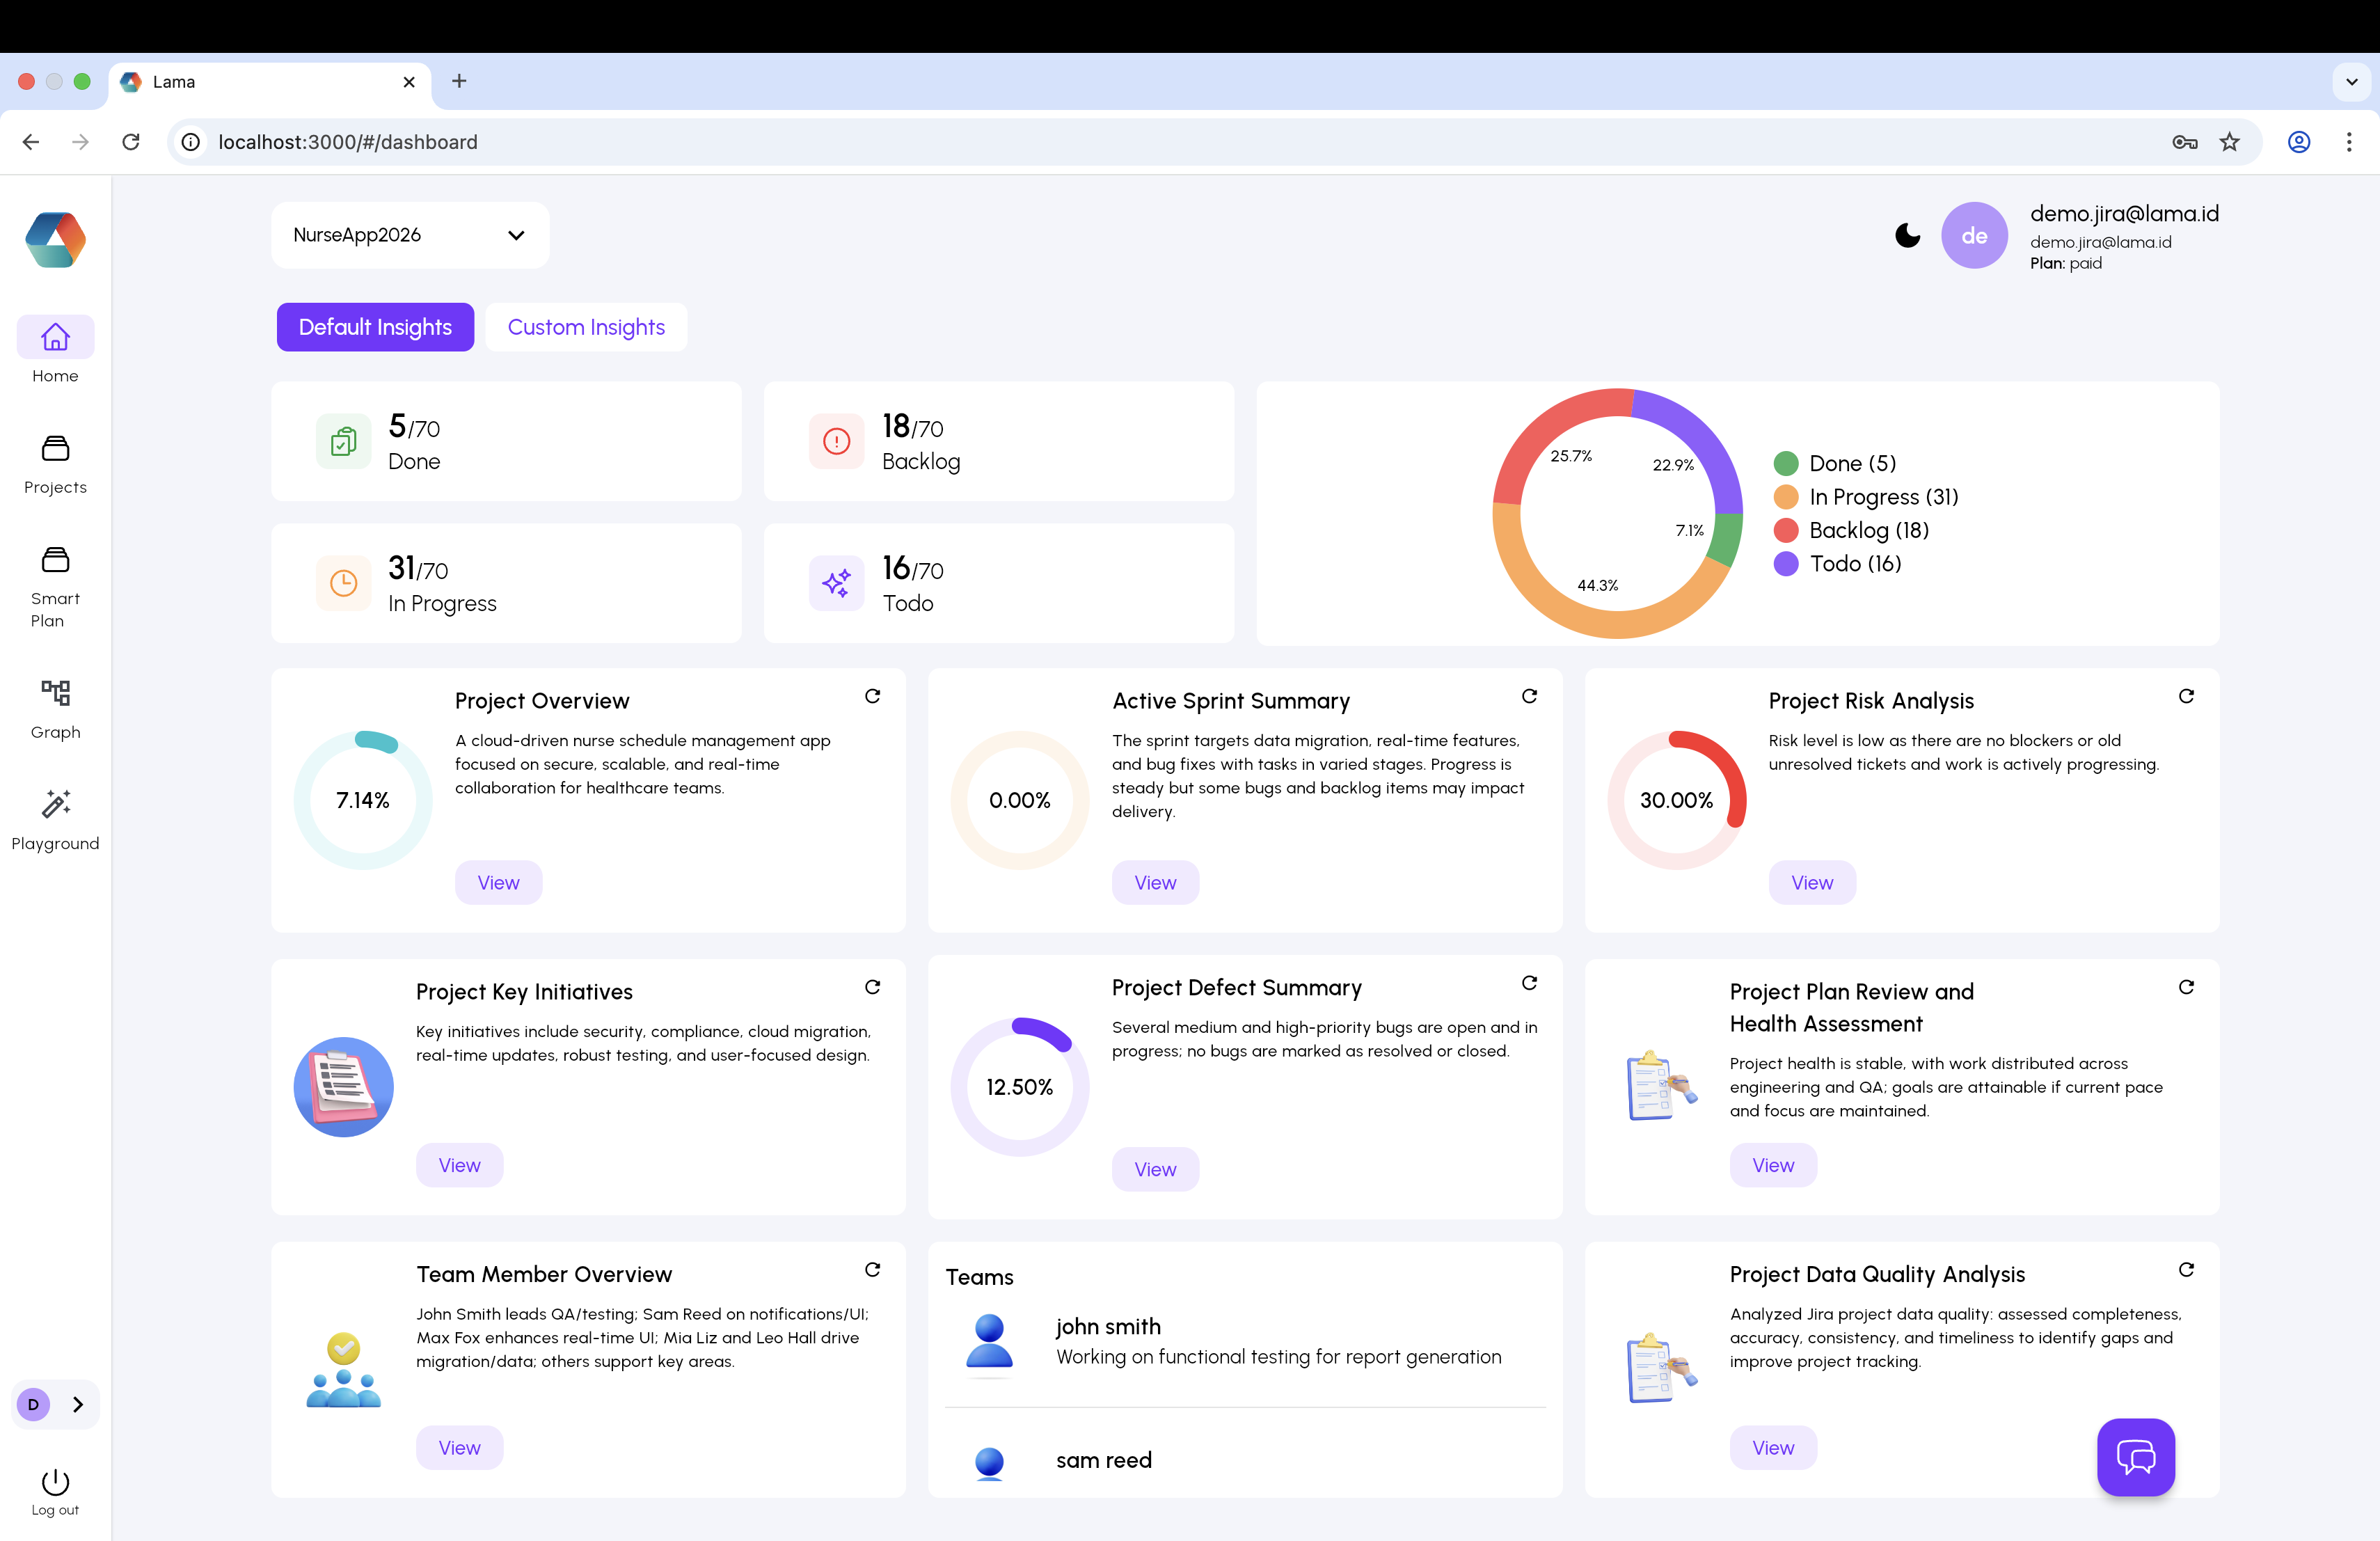
Auto-Generated Dashboards
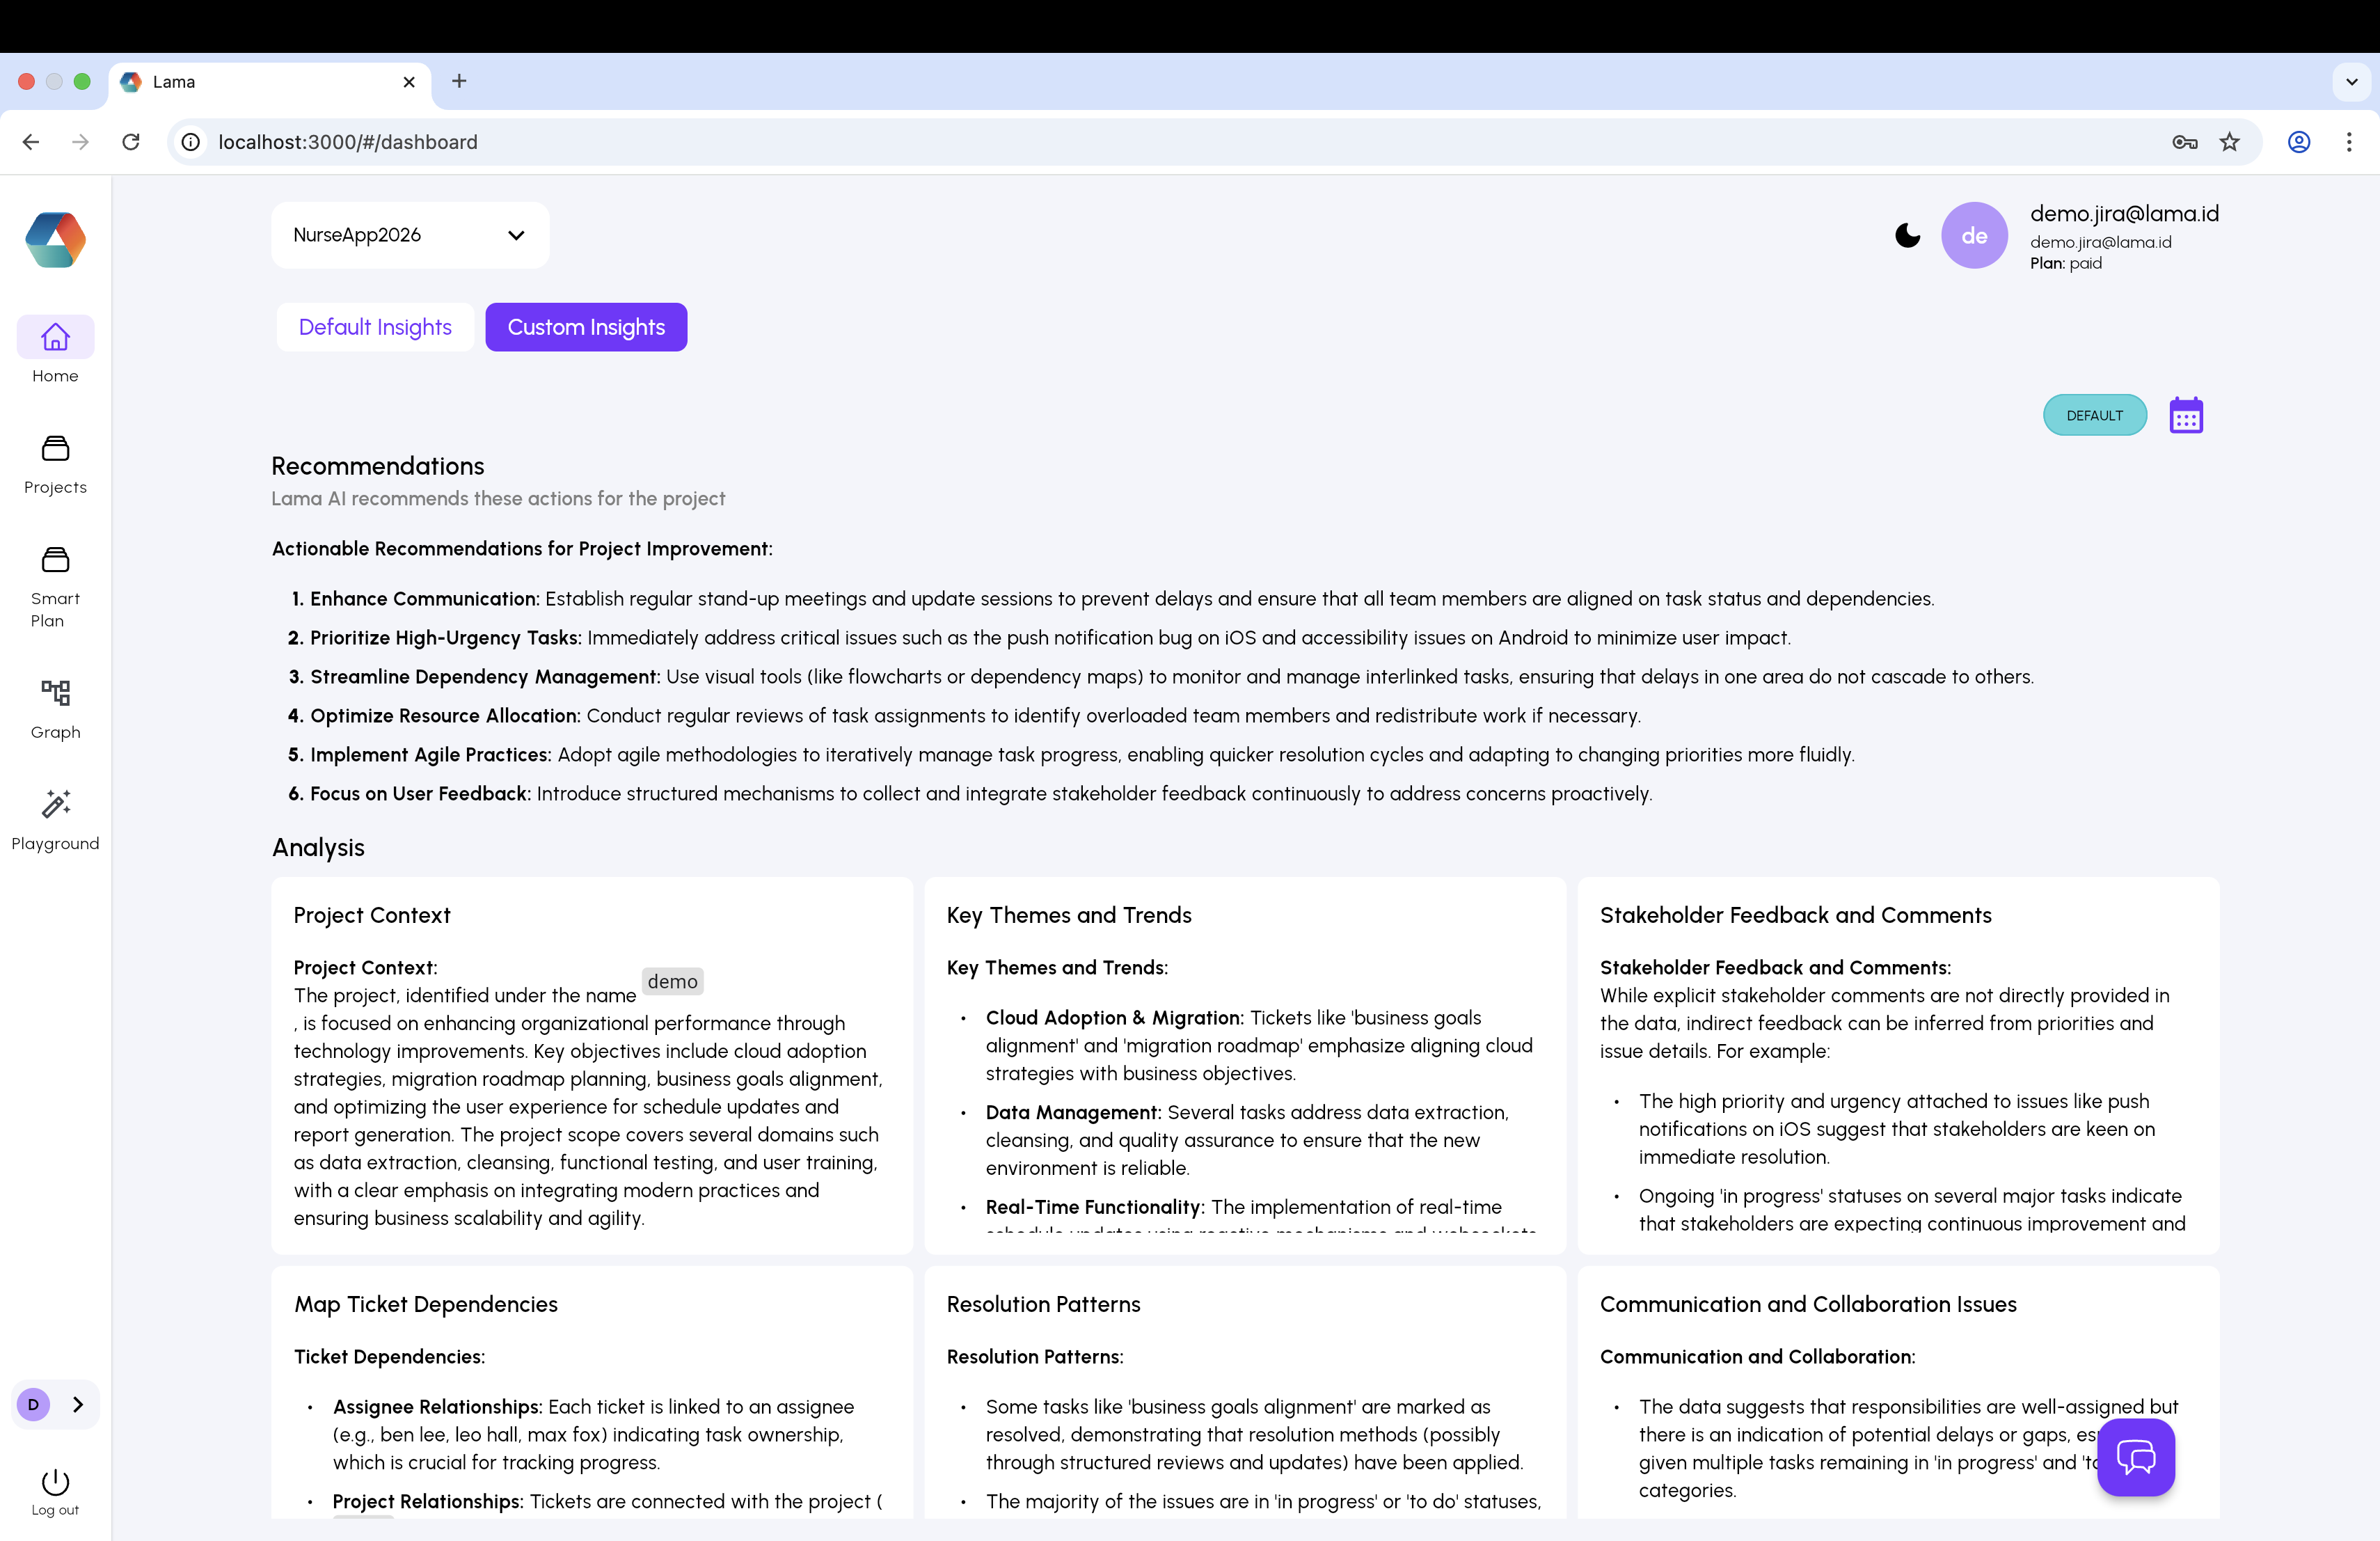
The Default Insights view answers the question "how is my project doing?" immediately on load. It surfaces task status breakdowns, a portfolio balance chart, sprint progress, and six AI-generated insight cards: Project Overview, Active Sprint Summary, Risk Analysis, Key Initiatives, Defect Summary, and Plan Health Assessment. Each card is independently refreshable and links to a detailed drill-down.
The Custom Insights tab generates structured long-form reports covering Project Context, Key Themes and Trends, Stakeholder Feedback, Dependency Maps, Resolution Patterns, and Communication Analysis.
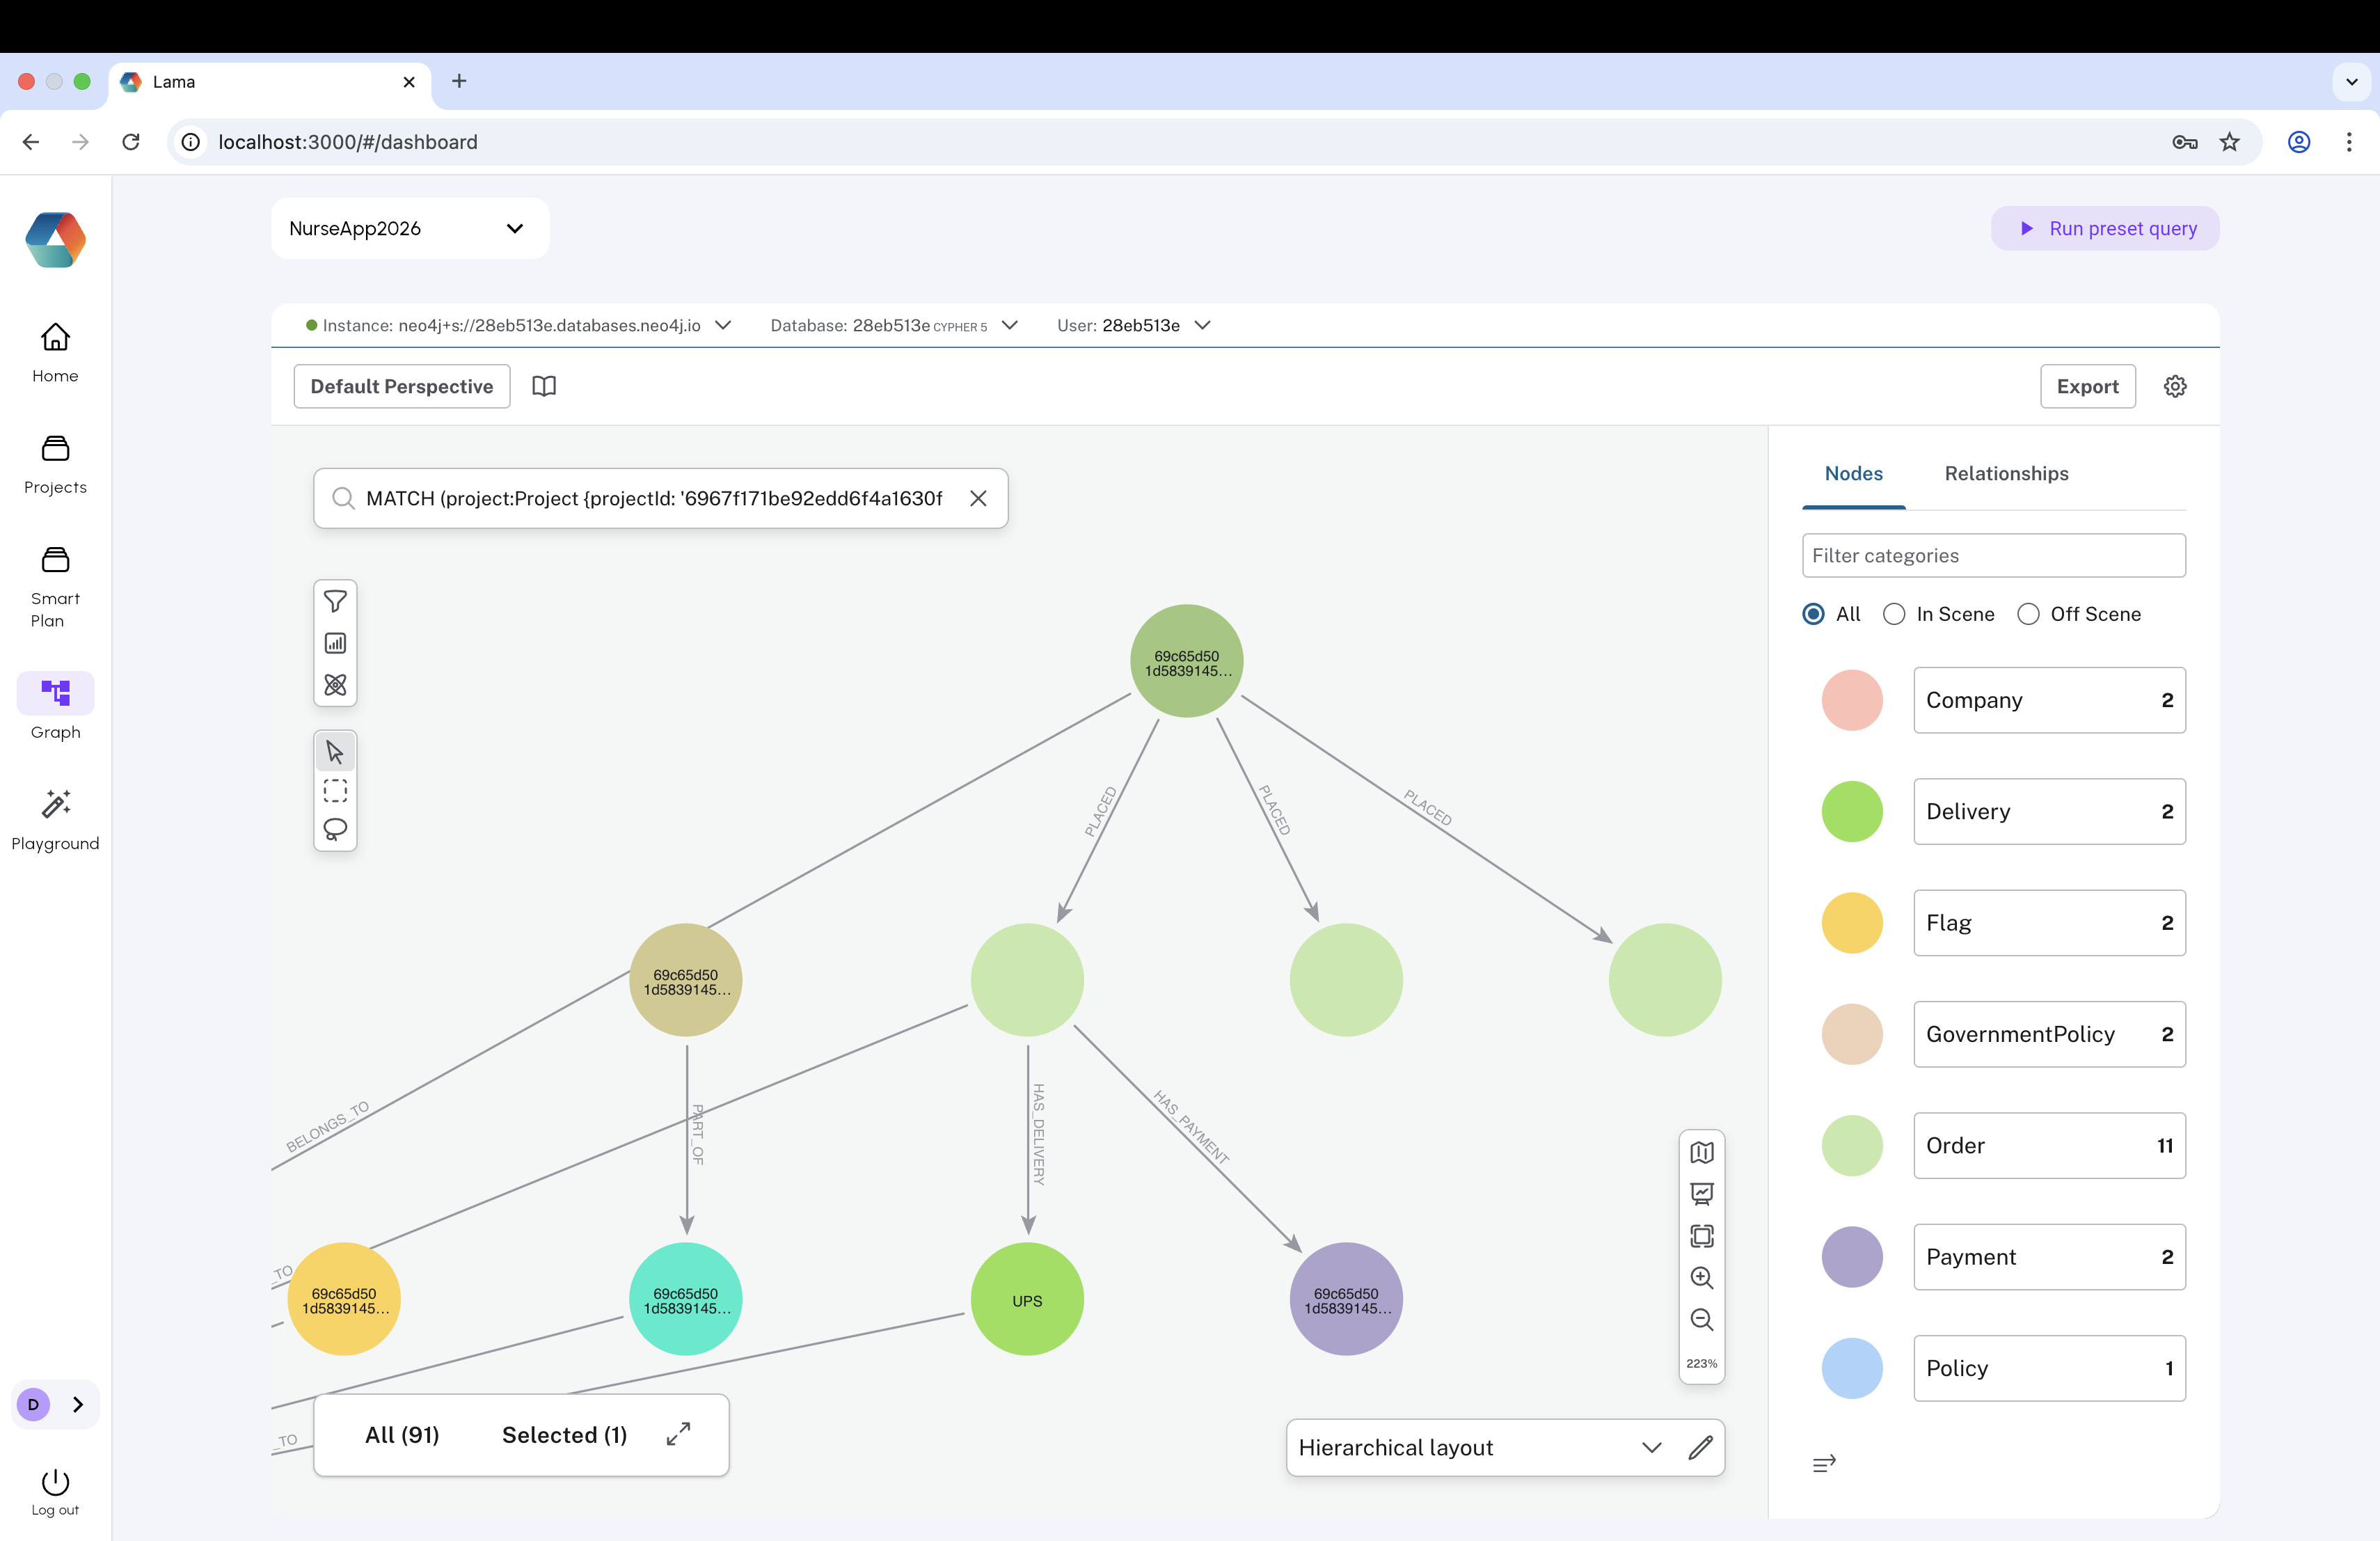
Graph Intelligence
Neo4j powers a live knowledge graph of tickets, teams, companies, policies, and dependencies. The Bloom-powered graph interface lets users query relationships visually - surfacing blockers, ownership chains, and structural risks that flat dashboards cannot show. This layer proved to be one of Lama's most differentiated capabilities.
Smart Plan
The Smart Plan feature extends Lama beyond read-only analytics into the project initiation workflow itself. Projects move through a guided pipeline: Upload → Plans → S.O.W → Jira Tickets → Release. Each stage is tracked and AI-assisted, from initial brief through to deployment readiness. This gives Lama richer context for analysis and creates stronger reasons for daily engagement.
Prioritised Recommendations
Every analysis concludes with ranked, contextual recommendations - not just observations. Users know precisely what to do next and why, without needing to interpret a chart or ask a follow-up question.
Product Design
The core UX principle behind Lama is that zero domain knowledge should be required to get value from the platform. Every screen is oriented around a business question rather than a data structure.
This sounds straightforward. In practice, it required constant pushback against the natural instinct of technical builders to expose control surfaces - configuration options, filter drop-downs, query inputs - that give power users flexibility but add friction for everyone else.
The decision to lead with AI-generated insight cards rather than a blank canvas or a drag-and-drop dashboard builder was deliberate. Most BI tools put the configuration burden on the user. Lama puts it on the system. The user's job is to read the insight and decide what to do - not to figure out which metric to put on which axis.
The graph view is the one exception to the simplicity principle, and deliberately so. It is presented as an exploration tool rather than a primary interface - accessible to users who want to go deeper, but never required for basic insight generation.
Technology
Lama's engineering challenge was significant: build a system that reliably ingests messy, multi-format data from a dozen sources, models it across four distinct database paradigms, and serves AI-generated analysis in near real-time — without requiring any user configuration.
Tech Stack
Backend: Node.js, Express.js, JavaScript - with JWT authentication, Helmet, CORS hardening, rate limiting, cron jobs, and Socket.IO for real-time event delivery.
Databases: MongoDB for unstructured project documents and AI output; Neo4j for graph modelling of ticket relationships, teams, and dependencies; PostgreSQL and MySQL for relational reporting; Qdrant for vector embeddings and semantic search; Redis for result caching.
AI / LLM Layer: OpenAI, Anthropic Claude, Google Gemini — abstracted behind a provider-agnostic orchestration layer.
Data Ingestion: CSV parsers, PDF/DOC extraction, Markdown and text utilities, Jira REST, ServiceNow connectors, web scrape and web crawl pipelines.
Front End: Flutter (Web), WebSocket, Auth0, Markdown rendering, Mermaid diagram support, Lottie animations, LogRocket session tracking, Neo4j Bloom for graph visualisation.
Engineering Decisions That Made the Difference
Service-oriented backend. Rather than a monolith, Lama's backend is a collection of focused service modules — one per domain. This allowed parallel development and made it practical to add new data sources or swap LLM providers without touching unrelated code.
Normalise at ingestion, not at query time. The transformation layer that converts CSV rows, Jira tickets, and web-scraped content into a unified internal schema is the least glamorous part of the platform — and the most important. Getting this right early paid dividends in every subsequent feature.
Polyglot persistence. Running five storage systems simultaneously is operationally complex. But storing data in the optimal engine for its access pattern — documents in MongoDB, relationships in Neo4j, embeddings in Qdrant, hot results in Redis — delivers query performance and analytical depth that a single-database approach cannot match.
Provider-agnostic LLM abstraction. All LLM calls are wrapped behind a provider-agnostic interface. This cost a small amount of engineering time upfront and has saved significant rework as models improved, pricing changed, and new providers entered the market.
Reliability layer. Background cron jobs, request retry logic, timeout management, and graceful degradation patterns were standardised across all API routes. Long-running AI analysis jobs that fail silently destroy user trust fast — especially in an enterprise context.
Why This Approach Worked
The non-negotiable constraint - that a non-technical business owner must be able to get value without help - forced every technical decision to be evaluated through a usability lens, not just an engineering lens.
The hybrid database strategy, counterintuitive in its complexity, was actually the key to simplicity at the UI layer. Because each data type is stored in the optimal engine, queries are fast and accurate without requiring the user to specify what they are looking for.
The graph database proved to be the biggest single differentiator. Surfacing ticket dependencies, team ownership chains, and structural blockers visually — without any user configuration — made patterns visible that flat dashboards cannot show. It also created a moat: a queryable, automatically-populated knowledge graph that compounds in value as more data accumulates is genuinely difficult to replicate quickly.
The decision to support multiple LLMs simultaneously — rather than betting on a single provider — also proved prescient. Different models perform differently on different analysis types, and routing tasks to the best available model improved output quality meaningfully.
Key Lessons From This Project
Design for the least technical user first. If a non-technical business owner can use it without help, technical users will find it fast and intuitive. Every screen, label, and default was stress-tested against that standard.
Normalise at ingestion, not at query time. The transformation layer is unsexy and unglamorous. Build it properly first. Every subsequent feature depends on it.
Polyglot persistence is worth the coordination overhead. The user experience gain from storing data in the right engine justified the operational complexity entirely.
Abstract LLM dependencies from day one. The AI landscape is moving fast. A provider-agnostic interface costs a small amount of upfront engineering and saves significant rework as the market evolves.
Reliability is a feature, not an afterthought. Robust timeout handling, retry logic, and clear status states are not optional in an enterprise product. Silent failures destroy trust faster than anything else.
The graph is the moat. Flat dashboards can be replicated relatively quickly. A live, automatically-populated knowledge graph of relationships and dependencies is a genuinely differentiated capability that gets harder to replicate the more data it accumulates.
Conclusion
Lama is proof that the bottleneck between business data and business decisions is not a technical problem — it is a product problem.
The data exists. The AI capabilities exist. The missing piece was a platform that assembled them into something a business owner could actually use, without a technical intermediary and without a weeks-long wait.
By treating non-technical self-service as a first-class engineering constraint, building a hybrid data architecture that matches storage to access pattern, and wrapping multi-LLM reasoning into a single coherent interface, Lama has fundamentally changed who gets to ask questions of data — and how quickly they get answers.
Adaptiv Admin
@admin
Building the future of AI products at Adaptiv.Me.
More Articles
Case Study: How Magic Was Built to Make Paris Feel Smaller
Case Study: How Globist Is Building the AI Workspace To Kill the Marketing Tab Spiral
Case Study: How Ask Sétu Was Built to Guide Indian Students Through Every Stage of Life in France
Case Study: How Paays built a one-of-a-kind travel lending experience